

by Laura McLeod Laura and the Beautification Committee BRCA Tree Team

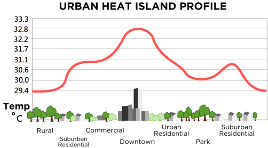
Last year we wrote about the Urban Heat Island effect: how buildings and streets warm the environment, and how trees and other vegetation can cool it. I’ve included the diagram as a reminder.
We have found a heat map of Bridgeland-Riverside, so you can see where it is hotter and where it is cooler in our community. The legend has items from other maps, so just look at the colours – the darker it is, the hotter. Not surprisingly, our coolest spots appear to be Murdoch Park and the escarpment above Schulepark (formerly Tynedale) and along the river. There is a hotter area around Edmonton Tr and 4 St.
What can we do to try to cool us off?
Researchers are looking at lighter coloured road surfaces which could help in the future. If your building has dark siding or a dark roof, when you need repairs or replacement, choose lighter coloured materials. The City will be planting more trees, particularly along the Main Streets project on 1 Avenue. Planting more trees on private land will help, since more land is private than City-owned, and the increased pressure of development in Bridgeland-Riverside is removing many of our bigger private trees. Using cooling systems in our homes will be increasingly necessary, as well as simple methods like closing window coverings during the day to decrease passive solar heating and opening windows at night to let in cooler air.
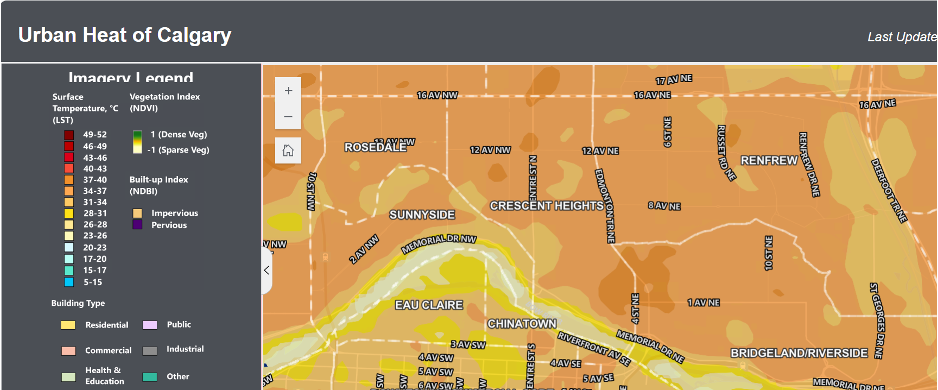
Credits: Thanks to Dee from the Crescent Heights Community Association for the map!
Click here to the Bridgeland Community News home page for the latest Bridgeland community updates.