


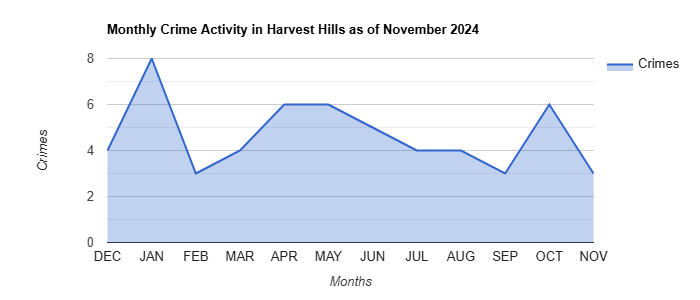
Harvest Hills Crime Activity was Down in November 2024
Harvest Hills Calgary experienced 3 crimes in November 2024, in comparison to 6 crimes the previous month, and 9 crimes in November one year ago. The Harvest Hills community has an average of 4.7 crimes per month. On an annual basis, Harvest Hills had a total of 56 crimes as of November 2024, which is down 36% in comparison to 88 crimes as of November 2023. Total Harvest Hills community crimes is calculated as the sum of break & enters (dwelling, commercial, and other premises), theft from vehicles, theft of vehicles, assaults (nondomestic), commercial robberies, street robberies, and non-domestic ‘other’ violence.
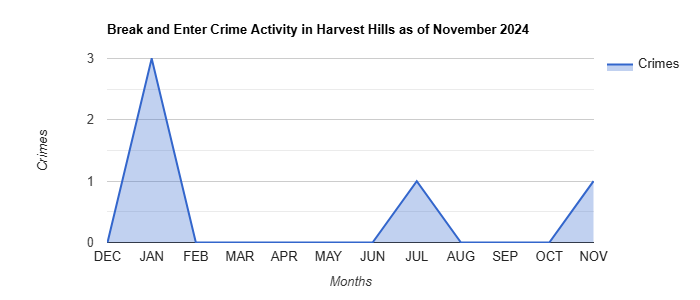
Harvest Hills Calgary had 1 break and enter (B&E) crime in November, in comparison to 0 B&E crimes in October and 1 B&E crime in November 2023. On an annual basis, Harvest Hills had a total of 5 B&E crimes as of November 2024, which is down from 13 B&E crimes as of November 2023.
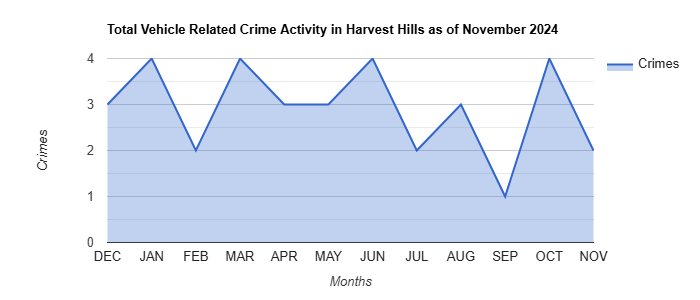
Harvest Hills had 2 vehicle related crimes (theft of or theft from vehicles) in November 2024, in comparison to 4 vehicle related crimes in the previous month, and 6 vehicle related crimes in November 2023. On an annual basis, Harvest Hills had a total of 35 vehicle related crimes as of November 2024, which is down in comparison to 58 vehicle related crimes as of November 2023.

Physical and social disorders are excluded from this article because a very low proportion of disorder-based calls for service result in crime reports. Physical and social disorders are often highly visible, occurring in public spaces; examples include public intoxication, panhandling, youth gangs, prostitution, littering, loitering and graffiti. Research indicates that disorders can have a negative impact on public perceptions of safety. See the Harvest Hills Crime Activity Table for additional information.
Harvest Hills Calgary Crime Activity Summary as of November 2024
|
|
NOV |
OCT |
SEP |
AUG |
JUL |
JUN |
MAY |
APR |
MAR |
FEB |
JAN |
DEC |
12 Month |
|---|---|---|---|---|---|---|---|---|---|---|---|---|---|
|
Assault (Non-domestic) |
0 |
2 |
2 |
1 |
1 |
1 |
1 |
1 |
0 |
1 |
0 |
1 |
11 |
|
Commercial Robbery |
0 |
0 |
0 |
0 |
0 |
0 |
0 |
0 |
0 |
0 |
0 |
0 |
0 |
|
Street Robbery |
0 |
0 |
0 |
0 |
0 |
0 |
0 |
1 |
0 |
0 |
0 |
0 |
1 |
|
Violence Other (Non-domestic) |
0 |
0 |
0 |
0 |
0 |
0 |
2 |
1 |
0 |
0 |
1 |
0 |
4 |
|
Break & Enter – Dwelling |
1 |
0 |
0 |
0 |
0 |
0 |
0 |
0 |
0 |
0 |
3 |
0 |
4 |
|
Break & Enter – Commercial |
0 |
0 |
0 |
0 |
0 |
0 |
0 |
0 |
0 |
0 |
0 |
0 |
0 |
|
Break & Enter – Other Premises |
0 |
0 |
0 |
0 |
1 |
0 |
0 |
0 |
0 |
0 |
0 |
0 |
1 |
|
Theft OF Vehicle |
1 |
1 |
0 |
2 |
1 |
0 |
0 |
0 |
1 |
0 |
0 |
1 |
7 |
|
Theft FROM Vehicle |
1 |
3 |
1 |
1 |
1 |
4 |
3 |
3 |
3 |
2 |
4 |
2 |
28 |
|
Total Crimes |
3 |
6 |
3 |
4 |
4 |
5 |
6 |
6 |
4 |
3 |
8 |
4 |
56 |
|
Total B&E Crimes |
1 |
0 |
0 |
0 |
1 |
0 |
0 |
0 |
0 |
0 |
3 |
0 |
5 |
|
Total Vehicle Crimes |
2 |
4 |
1 |
3 |
2 |
4 |
3 |
3 |
4 |
2 |
4 |
3 |
35 |
To see how crime activity in Harvest Hills compares to its neighboring communities, view the Total Crime Activity in the Nearby Communities Table below (sorted highest total annual crimes to lowest).
Total Crime Activity in Nearby Communities as of November 2024
|
|
NOV |
OCT |
SEP |
AUG |
JUL |
JUN |
MAY |
APR |
MAR |
FEB |
JAN |
DEC |
12 Month |
|---|---|---|---|---|---|---|---|---|---|---|---|---|---|
| Panorama Hills | 8 | 14 | 12 | 9 | 8 | 7 | 7 | 7 | 6 | 5 | 15 | 7 |
105 |
| Coventry Hills | 12 | 15 | 11 | 6 | 8 | 4 | 5 | 9 | 7 | 7 | 5 | 6 |
95 |
| Country Hills Village | 7 | 3 | 3 | 6 | 3 | 6 | 4 | 7 | 3 | 11 | 5 | 3 |
61 |
| Harvest Hills | 3 | 6 | 3 | 4 | 4 | 5 | 6 | 6 | 4 | 3 | 8 | 4 |
56 |
| Country Hills | 0 | 6 | 0 | 4 | 3 | 1 | 3 | 1 | 4 | 3 | 2 | 1 |
28 |
|
Total |
30 |
44 |
29 |
29 |
26 |
23 |
25 |
30 |
24 |
29 |
35 |
21 |
345 |
With a population of 7,420 residents, the Harvest Hills community recorded inf crimes per capita (per 1,000 community residents) in November 2024 vs its annual average of 0.63 crimes per capita. To see how crime per capita activity in Harvest Hills compares to its neighboring communities, view the Crime Per Capita Summary in Nearby Communities Table below (sorted highest to lowest by average annual crime per capita).
Crime Per Capita Summary in Nearby Communities as of November 2024
|
|
NOV |
OCT |
SEP |
AUG |
JUL |
JUN |
MAY |
APR |
MAR |
FEB |
JAN |
DEC |
12 Month |
|---|---|---|---|---|---|---|---|---|---|---|---|---|---|
| Country Hills Village | 2.70 | 1.16 | 1.16 | 2.31 | 1.16 | 2.31 | 1.54 | 2.70 | 1.16 | 4.24 | 1.93 | 1.16 |
1.96 |
| Harvest Hills | 0.40 | 0.81 | 0.40 | 0.54 | 0.54 | 0.67 | 0.81 | 0.81 | 0.54 | 0.40 | 1.08 | 0.54 |
0.63 |
| Country Hills | 0 | 1.59 | 0 | 1.06 | 0.80 | 0.27 | 0.80 | 0.27 | 1.06 | 0.80 | 0.53 | 0.27 |
0.62 |
| Coventry Hills | 0.68 | 0.85 | 0.62 | 0.34 | 0.45 | 0.23 | 0.28 | 0.51 | 0.40 | 0.40 | 0.28 | 0.34 |
0.45 |
| Panorama Hills | 0.31 | 0.54 | 0.47 | 0.35 | 0.31 | 0.27 | 0.27 | 0.27 | 0.23 | 0.19 | 0.58 | 0.27 |
0.34 |
|
Average |
0.82 |
0.99 |
0.53 |
0.92 |
0.65 |
0.75 |
0.74 |
0.91 |
0.68 |
1.21 |
0.88 |
0.52 |
0.80 |
With 1,125 total crimes, Connaught (Beltline) Calgary had the highest number of total crimes in the last twelve months, while Harvest Hills ranked 107th in Calgary. With an average rate of 15.51, the Belmont community had the highest annual crime per capita in Calgary.
In the last twelve months, with a per capita average of 0.00 crimes, the safest Calgary community was Mayfair, while Harvest Hills ranked 59th safest Community in Calgary. Ranked by lowest crime per capita, see Calgary’s 10 safest Communities in the table below.
Calgary’s Safest Communities (Total Crime Per Capita)
|
|
NOV |
OCT |
SEP |
AUG |
JUL |
JUN |
MAY |
APR |
MAR |
FEB |
JAN |
DEC |
12 Month |
|---|---|---|---|---|---|---|---|---|---|---|---|---|---|
| Mayfair | 0 | 0 | 0 | 0 | 0 | 0 | 0 | 0 | 0 | 0 | 0 | 0 |
0.00 |
| Royal Oak | 0.09 | 0.17 | 0 | 0.17 | 0.34 | 0.17 | 0.34 | 0.09 | 0.34 | 0.17 | 0 | 0.34 |
0.19 |
| Hamptons | 0.14 | 0.41 | 0.54 | 0 | 0.27 | 0.14 | 0.41 | 0.14 | 0.14 | 0 | 0.27 | 0 |
0.21 |
| Citadel | 0.20 | 0.30 | 0.30 | 0 | 0.30 | 0 | 0.30 | 0.20 | 0.30 | 0.30 | 0.30 | 0.20 |
0.23 |
| Rocky Ridge | 0.12 | 0.24 | 0 | 0.24 | 0.48 | 0.24 | 0.48 | 0.12 | 0.48 | 0.24 | 0 | 0.48 |
0.26 |
| Hawkwood | 0.22 | 0.32 | 0.22 | 0.22 | 0.43 | 0 | 0.32 | 0.22 | 0.11 | 0.22 | 0.32 | 0.54 |
0.26 |
| Coach Hill | 0 | 0 | 0 | 0 | 0.31 | 0 | 0.62 | 0.62 | 0.62 | 0.62 | 0.62 | 0 |
0.28 |
| Garrison Green | 0 | 0.49 | 0.97 | 0.97 | 0 | 0 | 0.49 | 0 | 0 | 0 | 0 | 0.49 |
0.28 |
| North Haven | 0 | 0.34 | 0.68 | 0.34 | 0.68 | 0 | 0.34 | 0 | 0.68 | 0 | 0.34 | 0 |
0.28 |
| Evergreen | 0.33 | 0.19 | 0.23 | 0.05 | 0.19 | 0.51 | 0.42 | 0.23 | 0.37 | 0.28 | 0.47 | 0.09 |
0.28 |
|
Average |
0.10 |
0.22 |
0.27 |
0.18 |
0.27 |
0.10 |
0.34 |
0.15 |
0.28 |
0.17 |
0.21 |
0.19 |
0.21 |
Feel free to share this report on your website, and social media platforms.
Click here to see our latest Harvest Hills Real Estate Statistics analysis
Click here to see our latest Safest Calgary Neighborhood Report
Click here to see our latest Harvest Hills Classified Ads
How To Report Crime In Harvest Hills: Dial 911 for emergencies or crimes in progress. For non-emergencies dial (403) 266-1234. To report a crime anonymously, contact Crime Stoppers at 1-800-222-8477 (Talk, Type or Text), submit tips online at crimestoppers.ab.ca or text tttTIPS to 274637.
What Else Can I Do To Secure My Home and Property? The Calgary Police Service encourages Calgarians to establish a 9 PM Secure Your Home and Property Routine before heading to bed. The routine recommends: Removing valuables from vehicles | Ensuring vehicles are locked, windows are closed and if possible, parked in a garage | Closing garage doors and windows | Locking any person-doors in the garage, including those leading into a house | Checking that all house doors – front, back, side and garage – are locked | Ensuring all windows are shut | Turning on an exterior light.
Do you know anyone in and around Harvest Hills that is struggling with alcohol and other drug dependencies? Consider contacting the Calgary Alpha House Society which is a local non-profit, charitable agency providing support to men and women whose lives have been impacted by alcohol and other drug dependencies. For individuals on the street needing assistance contact the 24/7 DOAP Team at 403-998-7388. To clean up needle and needle debris in Harvest Hills on public and private property contact the Needle Response Team at 403-796-5334. To seek assistance for individuals who are sleeping in camps outside in Harvest Hills contact the Encampment Team at 403-805-7388.
This Harvest Hills crime statistics report is sponsored by:
ADVERTISE YOUR BUSINESS IN HARVEST HILLS TODAY!: Looking to grow your business in Harvest Hills? We offer community engagement and community engagement to help you succeed. Call 403-720-0762 or visit greatnewsmedia.ca to start advertising today. Boost your visibility with proven results in Harvest Hills!
CALGARY BUSINESS BROKER SERVICING HARVEST HILLS: In Harvest Hills, Our team specializes in efficient transactions. We specialize in business valuations, sell-side mandates, and buy-side mandates. Rely on our expertise to streamline the process and ensure the best results. Contact us to make the most of your business opportunities. Call us at 1-403-249-2269 Visit us at www.bmaxbrokers.com
CALGARY MORTGAGE BROKER SERVICING HARVEST HILLS: Searching for Calgary mortgage support in Harvest Hills? Let Anita Mortgage simplify the process. Best rates and personalized service just for you. (403) 771-8771 or visit anitamortgage.ca
FOR SALE: HEIDELBERG SPEED MASTER SM52-6P PRINTING PRESS 6-COLOR, 4/2 CONFIGURATION: Upgrade your print shop with a Contact Mike Russell for printing press! This Heidelberg model is fully operational and includes Non-stop delivery system, CPC 1.04 control system, and MG Electric Refrigeration system. Reliable, efficient, and built for top-quality prints. Available now in Calgary. Call Mike at 403-333-4653 or check https://greatnewsmedia.ca/equipment-for-sale/.
TRANSFORM HARVEST HILLS’ OUTDOOR SPACES WITH PREMIER LANDSCAPING EXPERTS!: Upgrade your outdoor space in Harvest Hills with Jackson & Jackson Landscaping. We specialize in Calgary flagstone patios, Calgary natural stone patios, Calgary landscape consultation and more, ensuring top-quality results. Call (403) 256-9282 or visit https://jacksonjackson.ca/ to start your transformation today!
Monthly Harvest Hills crime statistics updates are produced by MyCalgary.com utilizing data from the Calgary Police Department. Source: Calgary Police Crime Statistical Data.
MyCalgary.com is owned and operated by Great News Media – Leaders in Community Focused Marketing.
Return to the Harvest Hills Community News home page for the latest Harvest Hills community updates.