

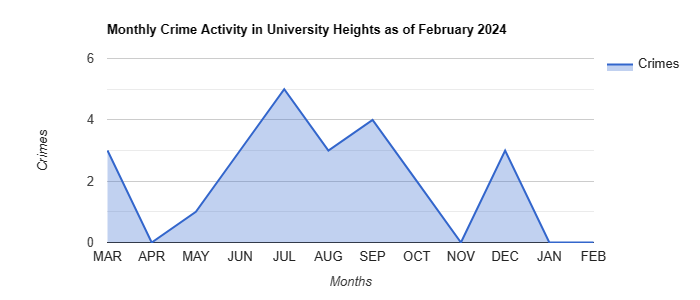
University Heights Crime Activity was Unchanged in February 2024
University Heights Calgary experienced 0 crimes in February 2024, in comparison to 0 crimes the previous month, and 10 crimes in February one year ago. The University Heights community has an average of 2.0 crimes per month. On an annual basis, University Heights had a total of 24 crimes as of February 2024, which is down 57% in comparison to 56 crimes as of February 2023. Total University Heights community crimes is calculated as the sum of break & enters (dwelling, commercial, and other premises), theft from vehicles, theft of vehicles, assaults (nondomestic), commercial robberies, street robberies, and non-domestic ‘other’ violence.
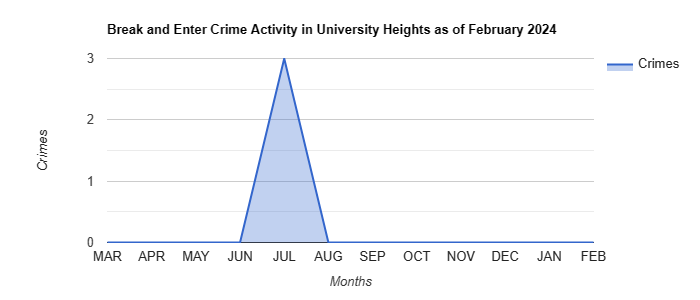
University Heights Calgary had 0 break and enter (B&E) crimes in February, in comparison to 0 B&E crimes in January and 2 B&E crimes in February 2023. On an annual basis, University Heights had a total of 3 B&E crimes as of February 2024, which is down from 11 B&E crimes as of February 2023.
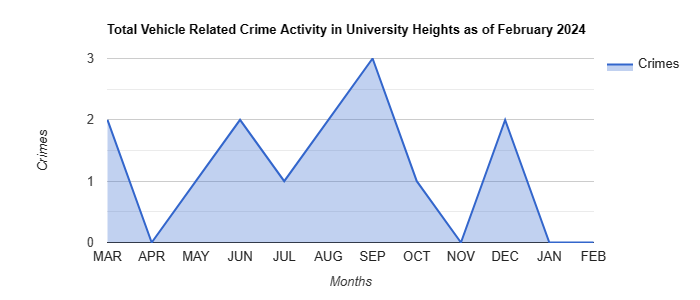
University Heights had 0 vehicle related crimes (theft of or theft from vehicles) in February 2024, in comparison to 0 vehicle related crimes in the previous month, and 8 vehicle related crimes in February 2023. On an annual basis, University Heights had a total of 14 vehicle related crimes as of February 2024, which is down in comparison to 43 vehicle related crimes as of February 2023.

Physical and social disorders are excluded from this article because a very low proportion of disorder-based calls for service result in crime reports. Physical and social disorders are often highly visible, occurring in public spaces; examples include public intoxication, panhandling, youth gangs, prostitution, littering, loitering and graffiti. Research indicates that disorders can have a negative impact on public perceptions of safety. See the University Heights Crime Activity Table for additional information.
University Heights Calgary Crime Activity Summary as of February 2024
|
|
FEB |
JAN |
DEC |
NOV |
OCT |
SEP |
AUG |
JUL |
JUN |
MAY |
APR |
MAR |
12 Month |
|---|---|---|---|---|---|---|---|---|---|---|---|---|---|
|
Assault (Non-domestic) |
0 |
0 |
1 |
0 |
1 |
1 |
0 |
0 |
0 |
0 |
0 |
0 |
3 |
|
Commercial Robbery |
0 |
0 |
0 |
0 |
0 |
0 |
0 |
0 |
0 |
0 |
0 |
0 |
0 |
|
Street Robbery |
0 |
0 |
0 |
0 |
0 |
0 |
0 |
0 |
0 |
0 |
0 |
0 |
0 |
|
Violence Other (Non-domestic) |
0 |
0 |
0 |
0 |
0 |
0 |
1 |
1 |
1 |
0 |
0 |
1 |
4 |
|
Break & Enter – Dwelling |
0 |
0 |
0 |
0 |
0 |
0 |
0 |
2 |
0 |
0 |
0 |
0 |
2 |
|
Break & Enter – Commercial |
0 |
0 |
0 |
0 |
0 |
0 |
0 |
0 |
0 |
0 |
0 |
0 |
0 |
|
Break & Enter – Other Premises |
0 |
0 |
0 |
0 |
0 |
0 |
0 |
1 |
0 |
0 |
0 |
0 |
1 |
|
Theft OF Vehicle |
0 |
0 |
1 |
0 |
0 |
1 |
1 |
0 |
1 |
0 |
0 |
1 |
5 |
|
Theft FROM Vehicle |
0 |
0 |
1 |
0 |
1 |
2 |
1 |
1 |
1 |
1 |
0 |
1 |
9 |
|
Total Crimes |
0 |
0 |
3 |
0 |
2 |
4 |
3 |
5 |
3 |
1 |
0 |
3 |
24 |
|
Total B&E Crimes |
0 |
0 |
0 |
0 |
0 |
0 |
0 |
3 |
0 |
0 |
0 |
0 |
3 |
|
Total Vehicle Crimes |
0 |
0 |
2 |
0 |
1 |
3 |
2 |
1 |
2 |
1 |
0 |
2 |
14 |
To see how crime activity in University Heights compares to its neighboring communities, view the Total Crime Activity in the Nearby Communities Table below (sorted highest total annual crimes to lowest).
Total Crime Activity in Nearby Communities as of February 2024
|
|
FEB |
JAN |
DEC |
NOV |
OCT |
SEP |
AUG |
JUL |
JUN |
MAY |
APR |
MAR |
12 Month |
|---|---|---|---|---|---|---|---|---|---|---|---|---|---|
| Banff Trail | 10 | 13 | 11 | 6 | 7 | 7 | 10 | 8 | 13 | 7 | 16 | 17 |
125 |
| Hounsfield Heights-Briar Hill | 5 | 5 | 10 | 9 | 6 | 9 | 7 | 13 | 11 | 12 | 17 | 15 |
119 |
| St. Andrew Heights | 5 | 5 | 10 | 9 | 6 | 9 | 7 | 13 | 11 | 12 | 17 | 15 |
119 |
| West Hillhurst | 4 | 1 | 3 | 4 | 5 | 11 | 11 | 17 | 10 | 5 | 13 | 6 |
90 |
| Parkdale | 1 | 3 | 4 | 5 | 0 | 3 | 4 | 3 | 2 | 1 | 3 | 1 |
30 |
| University District | 2 | 1 | 1 | 1 | 1 | 1 | 2 | 1 | 3 | 6 | 2 | 6 |
27 |
| University Heights | 0 | 0 | 3 | 0 | 2 | 4 | 3 | 5 | 3 | 1 | 0 | 3 |
24 |
|
Total |
27 |
28 |
42 |
34 |
27 |
44 |
44 |
60 |
53 |
44 |
68 |
63 |
534 |
With a population of 2,921 residents, the University Heights community recorded nan crimes per capita (per 1,000 community residents) in February 2024 vs its annual average of 0.69 crimes per capita. To see how crime per capita activity in University Heights compares to its neighboring communities, view the Crime Per Capita Summary in Nearby Communities Table below (sorted highest to lowest by average annual crime per capita).
Crime Per Capita Summary in Nearby Communities as of February 2024
|
|
FEB |
JAN |
DEC |
NOV |
OCT |
SEP |
AUG |
JUL |
JUN |
MAY |
APR |
MAR |
12 Month |
|---|---|---|---|---|---|---|---|---|---|---|---|---|---|
| St. Andrew Heights | 2.79 | 2.79 | 5.57 | 5.01 | 3.34 | 5.01 | 3.90 | 7.24 | 6.13 | 6.69 | 9.47 | 8.36 |
5.53 |
| Hounsfield Heights-Briar Hill | 1.79 | 1.79 | 3.57 | 3.22 | 2.14 | 3.22 | 2.50 | 4.65 | 3.93 | 4.29 | 6.08 | 5.36 |
3.55 |
| University District | 2.84 | 1.42 | 1.42 | 1.42 | 1.42 | 1.42 | 2.84 | 1.42 | 4.26 | 8.51 | 2.84 | 8.51 |
3.19 |
| Banff Trail | 2.41 | 3.13 | 2.65 | 1.44 | 1.69 | 1.69 | 2.41 | 1.93 | 3.13 | 1.69 | 3.85 | 4.09 |
2.51 |
| West Hillhurst | 0.62 | 0.16 | 0.47 | 0.62 | 0.78 | 1.71 | 1.71 | 2.64 | 1.55 | 0.78 | 2.02 | 0.93 |
1.17 |
| Parkdale | 0.39 | 1.17 | 1.56 | 1.95 | 0 | 1.17 | 1.56 | 1.17 | 0.78 | 0.39 | 1.17 | 0.39 |
0.98 |
| University Heights | 0 | 0 | 1.03 | 0 | 0.68 | 1.37 | 1.03 | 1.71 | 1.03 | 0.34 | 0 | 1.03 |
0.69 |
|
Average |
1.55 |
1.49 |
2.32 |
1.95 |
1.44 |
2.23 |
2.28 |
2.97 |
2.97 |
3.24 |
3.63 |
4.10 |
2.51 |
With 1,118 total crimes, Victoria Park Calgary had the highest number of total crimes in the last twelve months, while University Heights ranked 175th in Calgary. With an average rate of 15.92, the Meadowlark Park community had the highest annual crime per capita in Calgary.
In the last twelve months, with a per capita average of 0.02 crimes, the safest Calgary community was Valley Ridge, while University Heights ranked 65th safest Community in Calgary. Ranked by lowest crime per capita, see Calgary’s 10 safest Communities in the table below.
Calgary’s Safest Communities (Total Crime Per Capita)
|
|
FEB |
JAN |
DEC |
NOV |
OCT |
SEP |
AUG |
JUL |
JUN |
MAY |
APR |
MAR |
12 Month |
|---|---|---|---|---|---|---|---|---|---|---|---|---|---|
| Valley Ridge | 0 | 0 | 0.36 | 0.36 | 0 | 0 | 0.54 | 0.54 | 0 | 0.18 | 0.18 | 0 |
0.18 |
| Royal Oak | 0.17 | 0 | 0.34 | 0.26 | 0.09 | 0 | 0 | 0.17 | 0.68 | 0.17 | 0.34 | 0.34 |
0.21 |
| Hawkwood | 0.22 | 0.32 | 0.54 | 0.43 | 0.22 | 0.11 | 0 | 0.22 | 0.11 | 0.22 | 0.11 | 0.22 |
0.23 |
| Citadel | 0.10 | 0.30 | 0.20 | 0.20 | 0.20 | 0.20 | 0.20 | 0.10 | 0.20 | 0.50 | 0.30 | 0.20 |
0.23 |
| Evergreen | 0.28 | 0.47 | 0.05 | 0.37 | 0.23 | 0.28 | 0.19 | 0.28 | 0.28 | 0.23 | 0.28 | 0.23 |
0.26 |
| Evanston | 0.11 | 0.23 | 0.11 | 0.11 | 0.51 | 0.57 | 0.23 | 0.45 | 0.11 | 0.17 | 0.17 | 0.51 |
0.27 |
| Nolan Hill | 0.13 | 0.40 | 0.40 | 0.13 | 0.13 | 0.13 | 0.40 | 0.67 | 0.40 | 0.13 | 0.13 | 0.53 |
0.30 |
| Rocky Ridge | 0.24 | 0 | 0.48 | 0.36 | 0.12 | 0 | 0 | 0.24 | 0.95 | 0.24 | 0.48 | 0.48 |
0.30 |
| Coach Hill | 0.62 | 0.62 | 0 | 0.31 | 0 | 0.62 | 0.31 | 0 | 0 | 0.31 | 0 | 0.92 |
0.31 |
| Edgemont | 0.32 | 0.39 | 0.13 | 0.39 | 0.19 | 0.39 | 0.39 | 0.32 | 0.06 | 0.32 | 0.39 | 0.39 |
0.31 |
|
Average |
1.55 |
1.49 |
2.32 |
1.95 |
1.44 |
2.23 |
2.28 |
2.97 |
2.97 |
3.24 |
3.63 |
4.10 |
2.51 |
Feel free to share this report on your website, and social media platforms.
Click here to see our latest University Heights Real Estate Statistics analysis
Click here to see our latest Safest Calgary Neighborhood Report
Click here to see our latest University Heights Classified Ads
How To Report Crime In University Heights: Dial 911 for emergencies or crimes in progress. For non-emergencies dial (403) 266-1234. To report a crime anonymously, contact Crime Stoppers at 1-800-222-8477 (Talk, Type or Text), submit tips online at crimestoppers.ab.ca or text tttTIPS to 274637.
What Else Can I Do To Secure My Home and Property? The Calgary Police Service encourages Calgarians to establish a 9 PM Secure Your Home and Property Routine before heading to bed. The routine recommends: Removing valuables from vehicles | Ensuring vehicles are locked, windows are closed and if possible, parked in a garage | Closing garage doors and windows | Locking any person-doors in the garage, including those leading into a house | Checking that all house doors – front, back, side and garage – are locked | Ensuring all windows are shut | Turning on an exterior light.
Do you know anyone in and around University Heights that is struggling with alcohol and other drug dependencies? Consider contacting the Calgary Alpha House Society which is a local non-profit, charitable agency providing support to men and women whose lives have been impacted by alcohol and other drug dependencies. For individuals on the street needing assistance contact the 24/7 DOAP Team at 403-998-7388. To clean up needle and needle debris in University Heights on public and private property contact the Needle Response Team at 403-796-5334. To seek assistance for individuals who are sleeping in camps outside in University Heights contact the Encampment Team at 403-805-7388.
This University Heights crime statistics report is sponsored by Anita Lemke, University Heights Mortgage Broker. The terms of your mortgage may be costing you THOUSANDS MORE than you need to pay! As a local University Heights Mortgage Professional with more than a dozen years experience, I have helped your neighbours navigate their renewal, refinance, and purchase options. With lending partners ranging from major banks to private lenders, I have access to many financing options. If you are looking for a mortgage broker in University Heights, contact Anita @ 403-771-8771 | [email protected] | AnitaMortgage.ca | Licensed by Avenue Financial
This University Heights crime statistics report is also sponsored by Len T. Wong, University Heights realtor. With more than 33 years experience, Len has helped your University Heights neighbors buy and sell their homes. If you are looking for a realtor in University Heights, call or text Len @ 403-606-888 | [email protected] | Calgaryluxuryhomesearch.com/ | Licensed by The Greater Property Group.
This University Heights crime statistics report is also sponsored by University Heights landscaper, Jackson & Jackson Landscaping. Jackson & Jackson Landscaping have been serving Calgary since 1979 and we are well qualified to design and implement the landscaping needs of your home. We are an established business in University Heights with a reputation for providing outstanding quality landscaping and customer service. Call Cam at 403 371 3814 for a free consultation and quote. https://jacksonjackson.ca
Monthly University Heights crime statistics updates are produced by MyCalgary.com utilizing data from the Calgary Police Department. Source: Calgary Police Crime Statistical Data.
MyCalgary.com is owned and operated by Great News Media – Leaders in Community Focused Marketing.
Return to the University Heights Community News home page for the latest University Heights community updates.


