
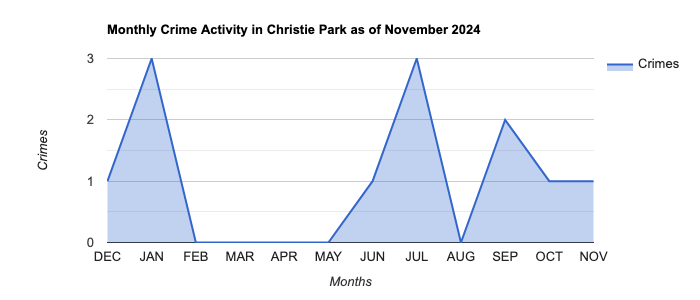
Christie Park Crime Activity was Unchanged in November 2024
Christie Park Calgary experienced 1 crime in November 2024, in comparison to 1 crime the previous month, and 1 crime in November one year ago. The Christie Park community has an average of 1.0 crimes per month. On an annual basis, Christie Park had a total of 12 crimes as of November 2024, which is down 59% in comparison to 29 crimes as of November 2023. Total Christie Park community crimes is calculated as the sum of break & enters (dwelling, commercial, and other premises), theft from vehicles, theft of vehicles, assaults (nondomestic), commercial robberies, street robberies, and non-domestic ‘other’ violence.
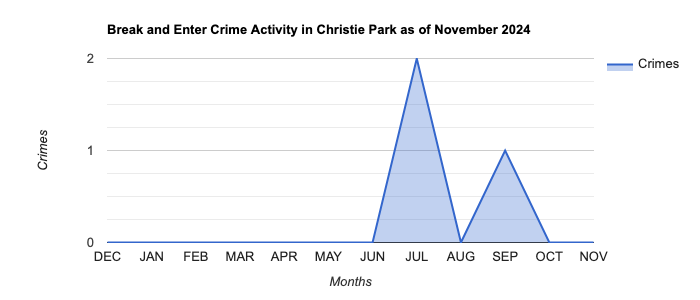
Christie Park Calgary had 0 break and enter (B&E) crimes in November, in comparison to 0 B&E crimes in October and 0 B&E crimes in November 2023. On an annual basis, Christie Park had a total of 3 B&E crimes as of November 2024, which is unchanged from 3 B&E crimes as of November 2023.
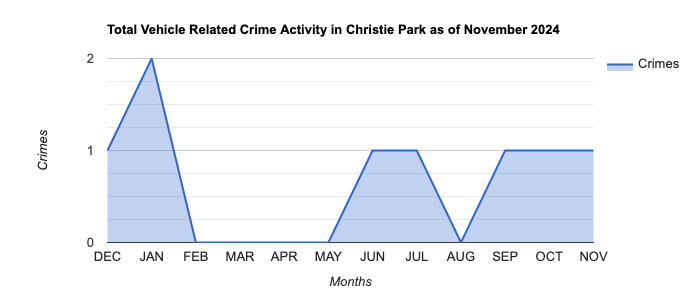
Christie Park had 1 vehicle related crime (theft of or theft from vehicles) in November 2024, in comparison to 1 vehicle related crime in the previous month, and 1 vehicle related crime in November 2023. On an annual basis, Christie Park had a total of 8 vehicle related crimes as of November 2024, which is down in comparison to 19 vehicle related crimes as of November 2023.

Physical and social disorders are excluded from this article because a very low proportion of disorder-based calls for service result in crime reports. Physical and social disorders are often highly visible, occurring in public spaces; examples include public intoxication, panhandling, youth gangs, prostitution, littering, loitering and graffiti. Research indicates that disorders can have a negative impact on public perceptions of safety. See the Christie Park Crime Activity Table for additional information.
Christie Park Calgary Crime Activity Summary as of November 2024
|
|
NOV |
OCT |
SEP |
AUG |
JUL |
JUN |
MAY |
APR |
MAR |
FEB |
JAN |
DEC |
12 Month |
|---|---|---|---|---|---|---|---|---|---|---|---|---|---|
|
Assault (Non-domestic) |
0 |
0 |
0 |
0 |
0 |
0 |
0 |
0 |
0 |
0 |
0 |
0 |
0 |
|
Commercial Robbery |
0 |
0 |
0 |
0 |
0 |
0 |
0 |
0 |
0 |
0 |
0 |
0 |
0 |
|
Street Robbery |
0 |
0 |
0 |
0 |
0 |
0 |
0 |
0 |
0 |
0 |
0 |
0 |
0 |
|
Violence Other (Non-domestic) |
0 |
0 |
0 |
0 |
0 |
0 |
0 |
0 |
0 |
0 |
1 |
0 |
1 |
|
Break & Enter – Dwelling |
0 |
0 |
0 |
0 |
1 |
0 |
0 |
0 |
0 |
0 |
0 |
0 |
1 |
|
Break & Enter – Commercial |
0 |
0 |
1 |
0 |
1 |
0 |
0 |
0 |
0 |
0 |
0 |
0 |
2 |
|
Break & Enter – Other Premises |
0 |
0 |
0 |
0 |
0 |
0 |
0 |
0 |
0 |
0 |
0 |
0 |
0 |
|
Theft OF Vehicle |
1 |
0 |
0 |
0 |
0 |
0 |
0 |
0 |
0 |
0 |
0 |
0 |
1 |
|
Theft FROM Vehicle |
0 |
1 |
1 |
0 |
1 |
1 |
0 |
0 |
0 |
0 |
2 |
1 |
7 |
|
Total Crimes |
1 |
1 |
2 |
0 |
3 |
1 |
0 |
0 |
0 |
0 |
3 |
1 |
12 |
|
Total B&E Crimes |
0 |
0 |
1 |
0 |
2 |
0 |
0 |
0 |
0 |
0 |
0 |
0 |
3 |
|
Total Vehicle Crimes |
1 |
1 |
1 |
0 |
1 |
1 |
0 |
0 |
0 |
0 |
2 |
1 |
8 |
To see how crime activity in Christie Park compares to its neighboring communities, view the Total Crime Activity in the Nearby Communities Table below (sorted highest total annual crimes to lowest).
Total Crime Activity in Nearby Communities as of November 2024
|
|
NOV |
OCT |
SEP |
AUG |
JUL |
JUN |
MAY |
APR |
MAR |
FEB |
JAN |
DEC |
12 Month |
|---|---|---|---|---|---|---|---|---|---|---|---|---|---|
| Signal Hill | 7 | 7 | 5 | 7 | 7 | 3 | 9 | 8 | 6 | 11 | 11 | 6 |
87 |
| Springbank Hill | 13 | 4 | 8 | 3 | 5 | 6 | 6 | 2 | 3 | 3 | 6 | 6 |
65 |
| Aspen Woods | 3 | 2 | 7 | 4 | 3 | 7 | 2 | 2 | 3 | 1 | 11 | 9 |
54 |
| West Springs | 6 | 8 | 5 | 2 | 3 | 2 | 4 | 8 | 3 | 4 | 5 | 3 |
53 |
| Strathcona | 3 | 0 | 3 | 0 | 2 | 4 | 1 | 2 | 0 | 2 | 9 | 6 |
32 |
| Cougar Ridge | 0 | 1 | 2 | 1 | 3 | 1 | 3 | 3 | 2 | 3 | 7 | 1 |
27 |
| Discovery Ridge | 4 | 2 | 3 | 0 | 1 | 5 | 2 | 3 | 1 | 0 | 1 | 1 |
23 |
| Patterson | 0 | 1 | 1 | 4 | 5 | 0 | 0 | 3 | 0 | 1 | 3 | 1 |
19 |
| Christie Park | 1 | 1 | 2 | 0 | 3 | 1 | 0 | 0 | 0 | 0 | 3 | 1 |
12 |
| Coach Hill | 0 | 0 | 0 | 0 | 1 | 0 | 2 | 2 | 2 | 2 | 2 | 0 |
11 |
|
Total |
37 |
26 |
36 |
21 |
33 |
29 |
29 |
33 |
20 |
27 |
58 |
34 |
383 |
With a population of 1,880 residents, the Christie Park community recorded inf crimes per capita (per 1,000 community residents) in November 2024 vs its annual average of 0.53 crimes per capita. To see how crime per capita activity in Christie Park compares to its neighboring communities, view the Crime Per Capita Summary in Nearby Communities Table below (sorted highest to lowest by average annual crime per capita).
Crime Per Capita Summary in Nearby Communities as of November 2024
|
|
NOV |
OCT |
SEP |
AUG |
JUL |
JUN |
MAY |
APR |
MAR |
FEB |
JAN |
DEC |
12 Month |
|---|---|---|---|---|---|---|---|---|---|---|---|---|---|
| Signal Hill | 0.54 | 0.54 | 0.38 | 0.54 | 0.54 | 0.23 | 0.69 | 0.62 | 0.46 | 0.85 | 0.85 | 0.46 |
0.56 |
| Springbank Hill | 1.32 | 0.41 | 0.81 | 0.30 | 0.51 | 0.61 | 0.61 | 0.20 | 0.30 | 0.30 | 0.61 | 0.61 |
0.55 |
| Christie Park | 0.53 | 0.53 | 1.06 | 0 | 1.60 | 0.53 | 0 | 0 | 0 | 0 | 1.60 | 0.53 |
0.53 |
| Aspen Woods | 0.32 | 0.21 | 0.74 | 0.42 | 0.32 | 0.74 | 0.21 | 0.21 | 0.32 | 0.11 | 1.17 | 0.95 |
0.48 |
| Discovery Ridge | 0.92 | 0.46 | 0.69 | 0 | 0.23 | 1.15 | 0.46 | 0.69 | 0.23 | 0 | 0.23 | 0.23 |
0.44 |
| Strathcona | 0.44 | 0 | 0.44 | 0 | 0.29 | 0.59 | 0.15 | 0.29 | 0 | 0.29 | 1.32 | 0.88 |
0.39 |
| West Springs | 0.52 | 0.69 | 0.43 | 0.17 | 0.26 | 0.17 | 0.35 | 0.69 | 0.26 | 0.35 | 0.43 | 0.26 |
0.38 |
| Patterson | 0 | 0.24 | 0.24 | 0.97 | 1.21 | 0 | 0 | 0.72 | 0 | 0.24 | 0.72 | 0.24 |
0.38 |
| Cougar Ridge | 0 | 0.14 | 0.28 | 0.14 | 0.42 | 0.14 | 0.42 | 0.42 | 0.28 | 0.42 | 0.98 | 0.14 |
0.32 |
| Coach Hill | 0 | 0 | 0 | 0 | 0.31 | 0 | 0.61 | 0.61 | 0.61 | 0.61 | 0.61 | 0 |
0.28 |
|
Average |
0.46 |
0.32 |
0.51 |
0.25 |
0.57 |
0.42 |
0.35 |
0.45 |
0.25 |
0.32 |
0.85 |
0.43 |
0.43 |
With 1,125 total crimes, Connaught (Beltline) Calgary had the highest number of total crimes in the last twelve months, while Christie Park ranked 189th in Calgary. With an average rate of 15.71, the Eagle Ridge community had the highest annual crime per capita in Calgary.
In the last twelve months, with a per capita average of 0.00 crimes, the safest Calgary community was Mayfair, while Christie Park ranked 45th safest Community in Calgary. Ranked by lowest crime per capita, see Calgary’s 10 safest Communities in the table below.
Calgary’s Safest Communities (Total Crime Per Capita)
|
|
NOV |
OCT |
SEP |
AUG |
JUL |
JUN |
MAY |
APR |
MAR |
FEB |
JAN |
DEC |
12 Month |
|---|---|---|---|---|---|---|---|---|---|---|---|---|---|
| Mayfair | 0 | 0 | 0 | 0 | 0 | 0 | 0 | 0 | 0 | 0 | 0 | 0 |
0.00 |
| Royal Oak | 0.09 | 0.17 | 0 | 0.17 | 0.35 | 0.17 | 0.35 | 0.09 | 0.35 | 0.17 | 0 | 0.35 |
0.19 |
| Hamptons | 0.14 | 0.41 | 0.54 | 0 | 0.27 | 0.14 | 0.41 | 0.14 | 0.14 | 0 | 0.27 | 0 |
0.21 |
| Citadel | 0.20 | 0.29 | 0.29 | 0 | 0.29 | 0 | 0.29 | 0.20 | 0.29 | 0.29 | 0.29 | 0.20 |
0.22 |
| Rocky Ridge | 0.12 | 0.24 | 0 | 0.24 | 0.49 | 0.24 | 0.49 | 0.12 | 0.49 | 0.24 | 0 | 0.49 |
0.26 |
| Hawkwood | 0.22 | 0.33 | 0.22 | 0.22 | 0.44 | 0 | 0.33 | 0.22 | 0.11 | 0.22 | 0.33 | 0.55 |
0.27 |
| Coach Hill | 0 | 0 | 0 | 0 | 0.31 | 0 | 0.61 | 0.61 | 0.61 | 0.61 | 0.61 | 0 |
0.28 |
| Evergreen | 0.34 | 0.19 | 0.24 | 0.05 | 0.19 | 0.53 | 0.43 | 0.24 | 0.38 | 0.29 | 0.48 | 0.10 |
0.29 |
| Evanston | 0.21 | 0.21 | 0.75 | 0.27 | 0.43 | 0.32 | 0.37 | 0.16 | 0.37 | 0.16 | 0.21 | 0.11 |
0.30 |
| Cougar Ridge | 0 | 0.14 | 0.28 | 0.14 | 0.42 | 0.14 | 0.42 | 0.42 | 0.28 | 0.42 | 0.98 | 0.14 |
0.32 |
|
Average |
0.12 |
0.18 |
0.21 |
0.10 |
0.29 |
0.14 |
0.34 |
0.20 |
0.27 |
0.22 |
0.29 |
0.18 |
0.21 |
Feel free to share this report on your website, and social media platforms.
Click here to see our latest Christie Park Real Estate Statistics analysis
Click here to see our latest Safest Calgary Neighborhood Report
Click here to see our latest Christie Park Classified Ads
How To Report Crime In Christie Park: Dial 911 for emergencies or crimes in progress. For non-emergencies dial (403) 266-1234. To report a crime anonymously, contact Crime Stoppers at 1-800-222-8477 (Talk, Type or Text), submit tips online at crimestoppers.ab.ca or text tttTIPS to 274637.
What Else Can I Do To Secure My Home and Property? The Calgary Police Service encourages Calgarians to establish a 9 PM Secure Your Home and Property Routine before heading to bed. The routine recommends: Removing valuables from vehicles | Ensuring vehicles are locked, windows are closed and if possible, parked in a garage | Closing garage doors and windows | Locking any person-doors in the garage, including those leading into a house | Checking that all house doors – front, back, side and garage – are locked | Ensuring all windows are shut | Turning on an exterior light.
Do you know anyone in and around Christie Park that is struggling with alcohol and other drug dependencies? Consider contacting the Calgary Alpha House Society which is a local non-profit, charitable agency providing support to men and women whose lives have been impacted by alcohol and other drug dependencies. For individuals on the street needing assistance contact the 24/7 DOAP Team at 403-998-7388. To clean up needle and needle debris in Christie Park on public and private property contact the Needle Response Team at 403-796-5334. To seek assistance for individuals who are sleeping in camps outside in Christie Park contact the Encampment Team at 403-805-7388.
This Christie Park crime statistics report is sponsored by:
Monthly Christie Park crime statistics updates are produced by MyCalgary.com utilizing data from the Calgary Police Department. Source: Calgary Police Crime Statistical Data.
MyCalgary.com is owned and operated by Great News Media – Leaders in Community Focused Marketing.
Return to the Christie Park Community News home page for the latest Christie Park community updates.